SolarSync

One platform to monitor every project. Seven integrations syncing every 15 minutes. Instead of logging into multiple platforms to answer a simple question, log into one and get everything you need.

every project you monitor, on one screen

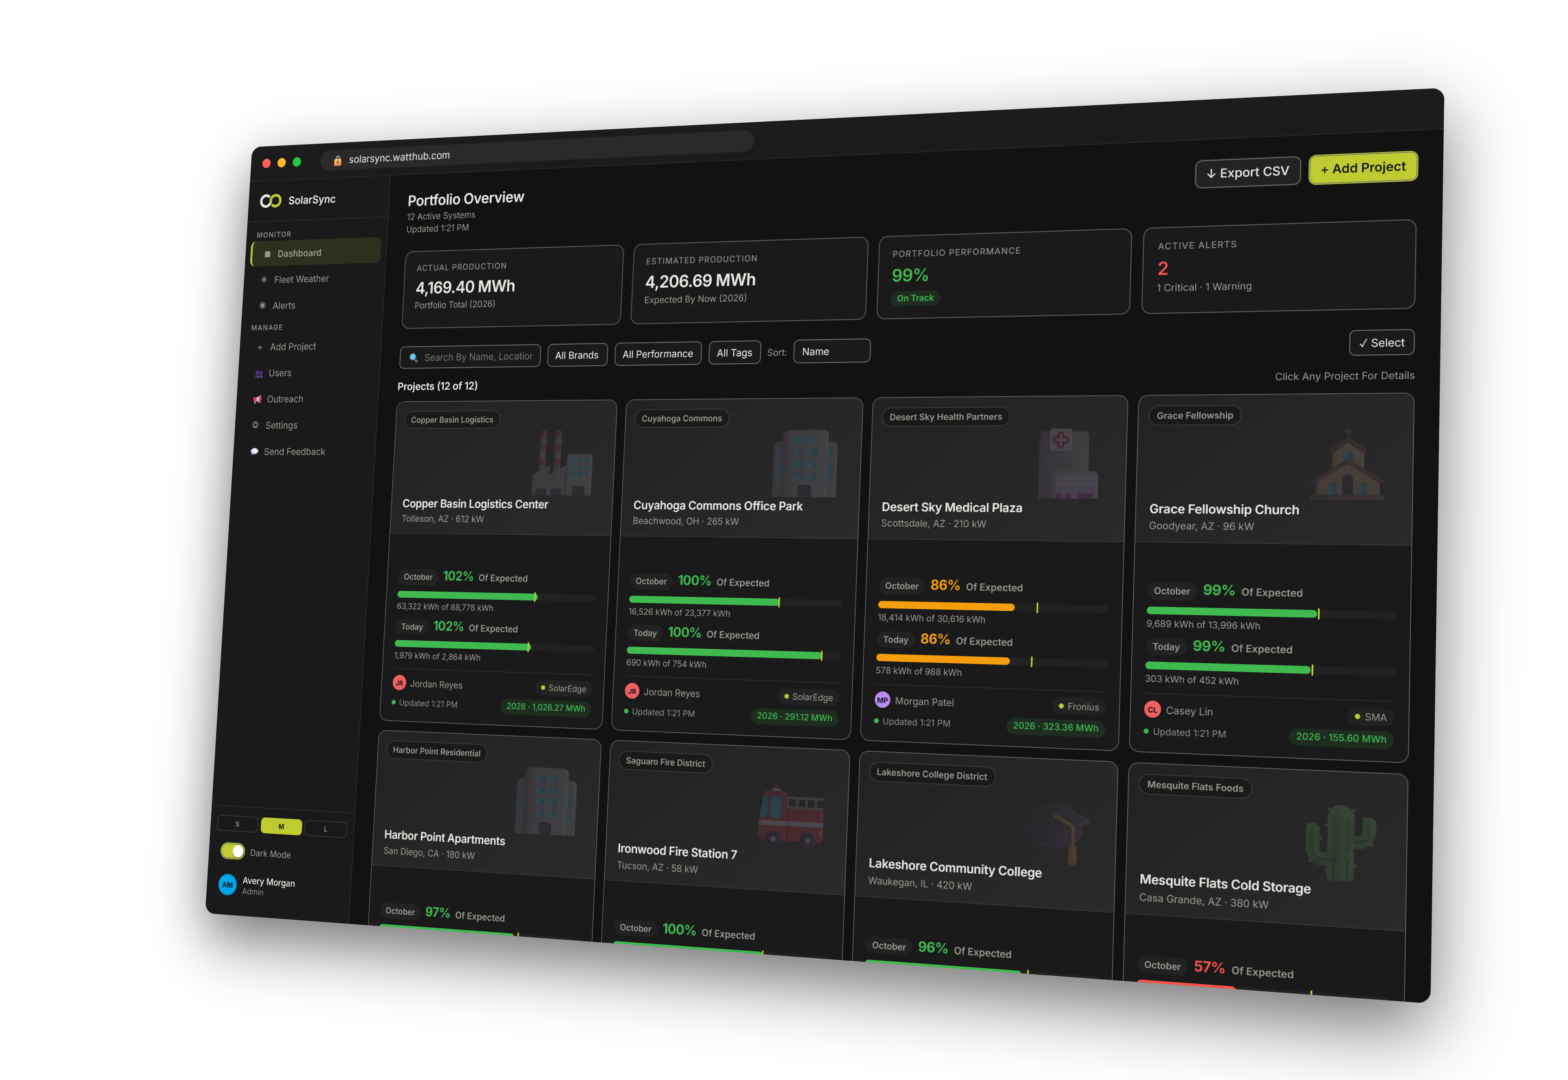
Dark dashboard UI showing a 'Portfolio Overview' with metric cards and left navigation panel (Monitor, Dashboard, Alerts).

one hub for monitoring performance

We got tired of checking different monitoring platforms so we built one to handle them all. Made with every person involved in a project in mind, SolarSync gives you all the information upfront. With live production alerts, weather reports per project, and additional analyses, be the most informed you've ever been with your project.

what solarsync does

A lot more than just monitoring production.

Green bar chart with an upward trending line and a sun-like coin symbol, conveying financial growth/profit increase.

Post Solar Analysis

Pre-solar bills against post-solar bills, in kWh and in dollars. Ten KPI tiles, blended $/kWh before and after, post-solar LCOE, and the one that matters most — what the sales proposal promised sitting directly beside what actually happened. A twenty-five-year projection carries compounding utility escalation at 3%/yr by default and marks the loan payoff year. Cash, loan or PPA.

Seven Inverters, One Portfolio

SolarEdge, eGauge, Fronius, SMA, Solis, Enphase, and Chint/CPS are synced over live, server-side integrations. One project can even have several systems of different brands at once, each with its own specs and sync state, on its own tab.

Refresh/auto-update icon with circular arrows surrounding a lightning bolt, indicating energy refresh or restart.

Live production alerts

Ten trigger types, eleven independent server-side detectors. Customize your production warning levels to get alerts when you want to. Month-to-date targets are pro-rated against the solar production window rather than the clock, so a healthy system never reads 92% at six in the morning. Alerts delivered over email, SMS, and push notifications.

Weather models per project

Cloud weight, temperature coefficient and rain and drizzle penalties are fitted to each project separately by an RMSE grid search over that project's own history — thirty training day-pairs, backfilled automatically over up to twelve passes. Then each day's shortfall is split into cloud, precipitation and temperature, additively. Days can be excluded so an inverter outage doesn't poison the fit.

Line drawing showing a wind turbine beside a solar panel and a circular renewable energy symbol, representing clean power sources.

Import production baselines

Import the Helioscope or Aurora Design Overview PDF. SolarSync reads every field segment, runs PVWatts® once per segment and sums the results element by element — 8,760 hourly AC kWh values behind each model run. Averaging a forty-segment roof into one array that exists nowhere is wrong by ten to twenty percent, and that error follows the project forever. PVWatts CSV and PVWatts PDF import too.

Green bar chart with a descending arrow indicating a drop in metrics/performance.

Export the data

Portfolio CSV, per-project multi-sheet XLSX, and a range export of any window up to five years per file at Daily, Hourly or 15-Minute granularity. Plus a customer-facing Print Report — a clean light-theme document that prints straight to PDF for a board packet, a landlord or a lender.

built for everyone involved

INSTALLERS. Developers. EPCs.

If two months of production run low, the customer begins to question if their system is broken. “It was cloudy” is a pretty weak answer unless you can show the data. SolarSync tracks the weather forecast for each individual project on the same screen so you don’t have to cross reference multiple sources.

With Fleet Weather, sort your entire portfolio by performance and immediately see how much a system might be impacted by weather.

  • Every brand you have ever installed, in one table. Seven live integrations syncing every fifteen minutes, and a project can carry systems from several brands at once.
  • The estimate matches the roof you actually built, because it came from your Helioscope or Aurora PDF one field segment at a time rather than one averaged azimuth.
  • Alerts that know what time it is. Month-to-date targets are pro-rated against the solar production window, not the clock, so a healthy system doesn’t read 92% at 6am and 106% at 5pm and fire phantom alerts in between.
  • Outreach, service reminders and customer requests all live beside the production data — a recommendation queue you edit before sending, a 3 / 6 / 12-month reminder cadence, and requests that run Awaiting Approval → New → In Progress → Awaiting Customer → Closed.

Weather data: Open-Meteo.com (CC-BY 4.0) + NWS. Modeling baseline production is NREL PVWatts.


system owners & Customers.

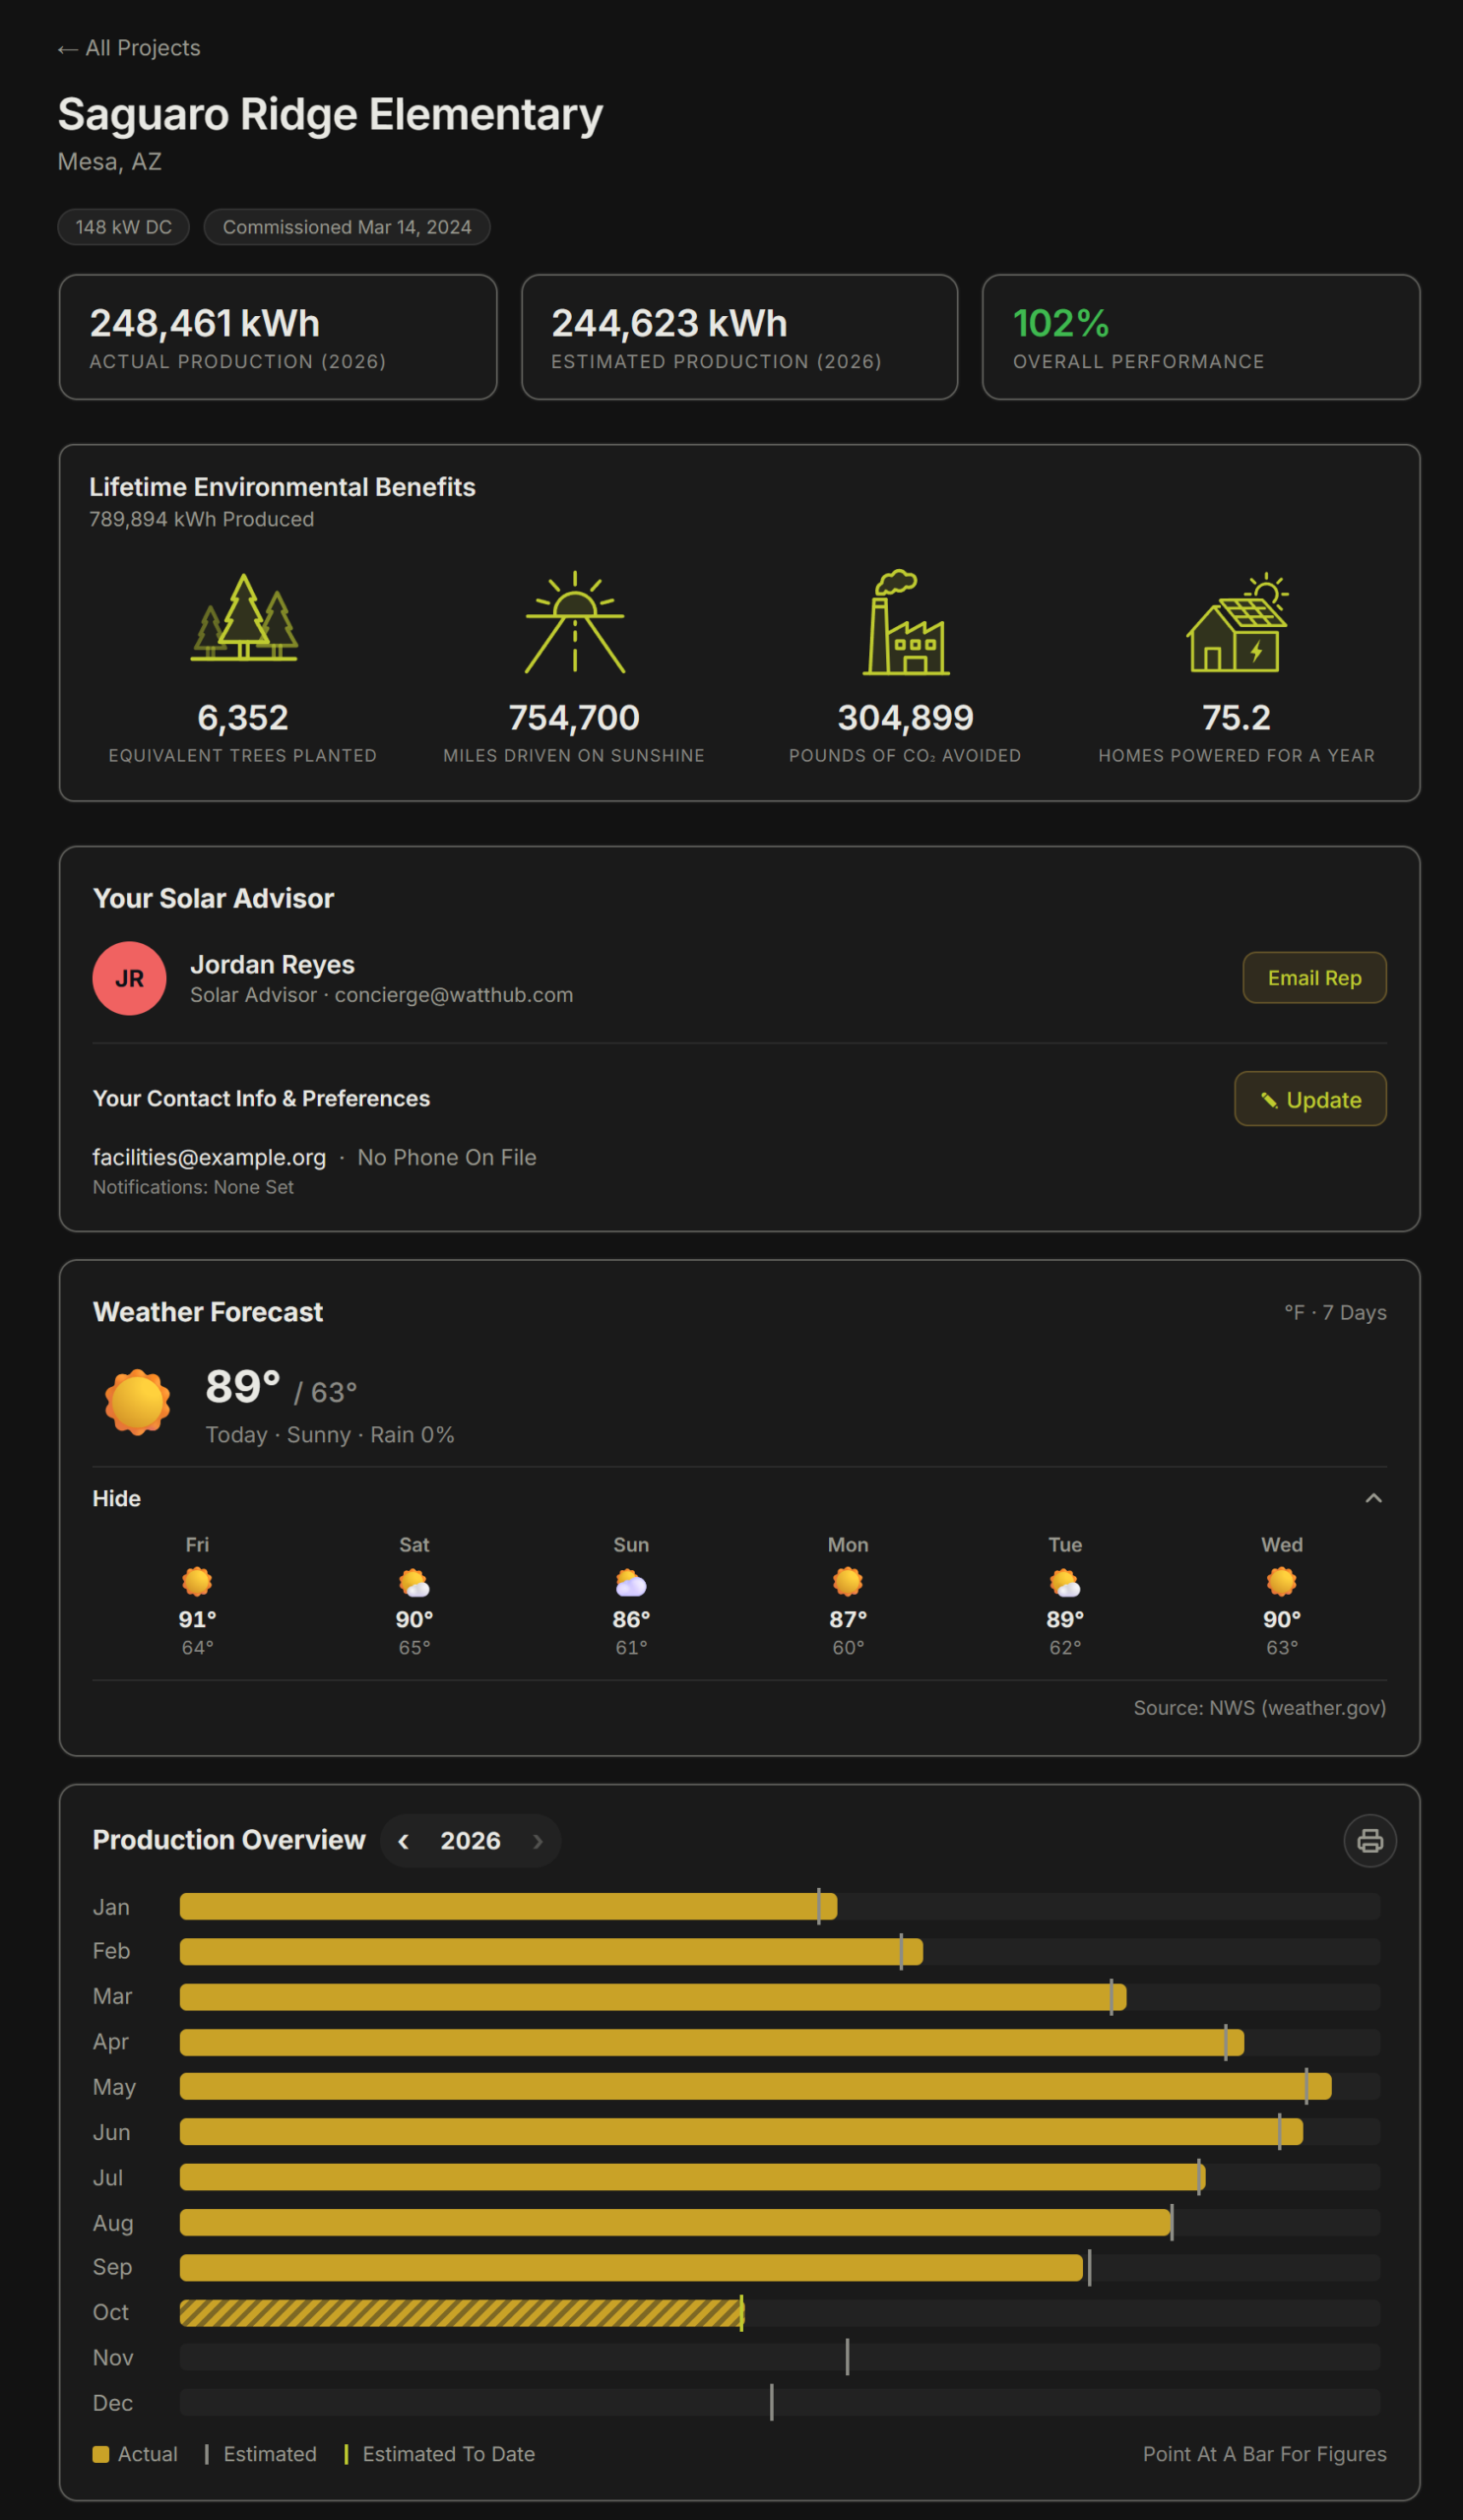
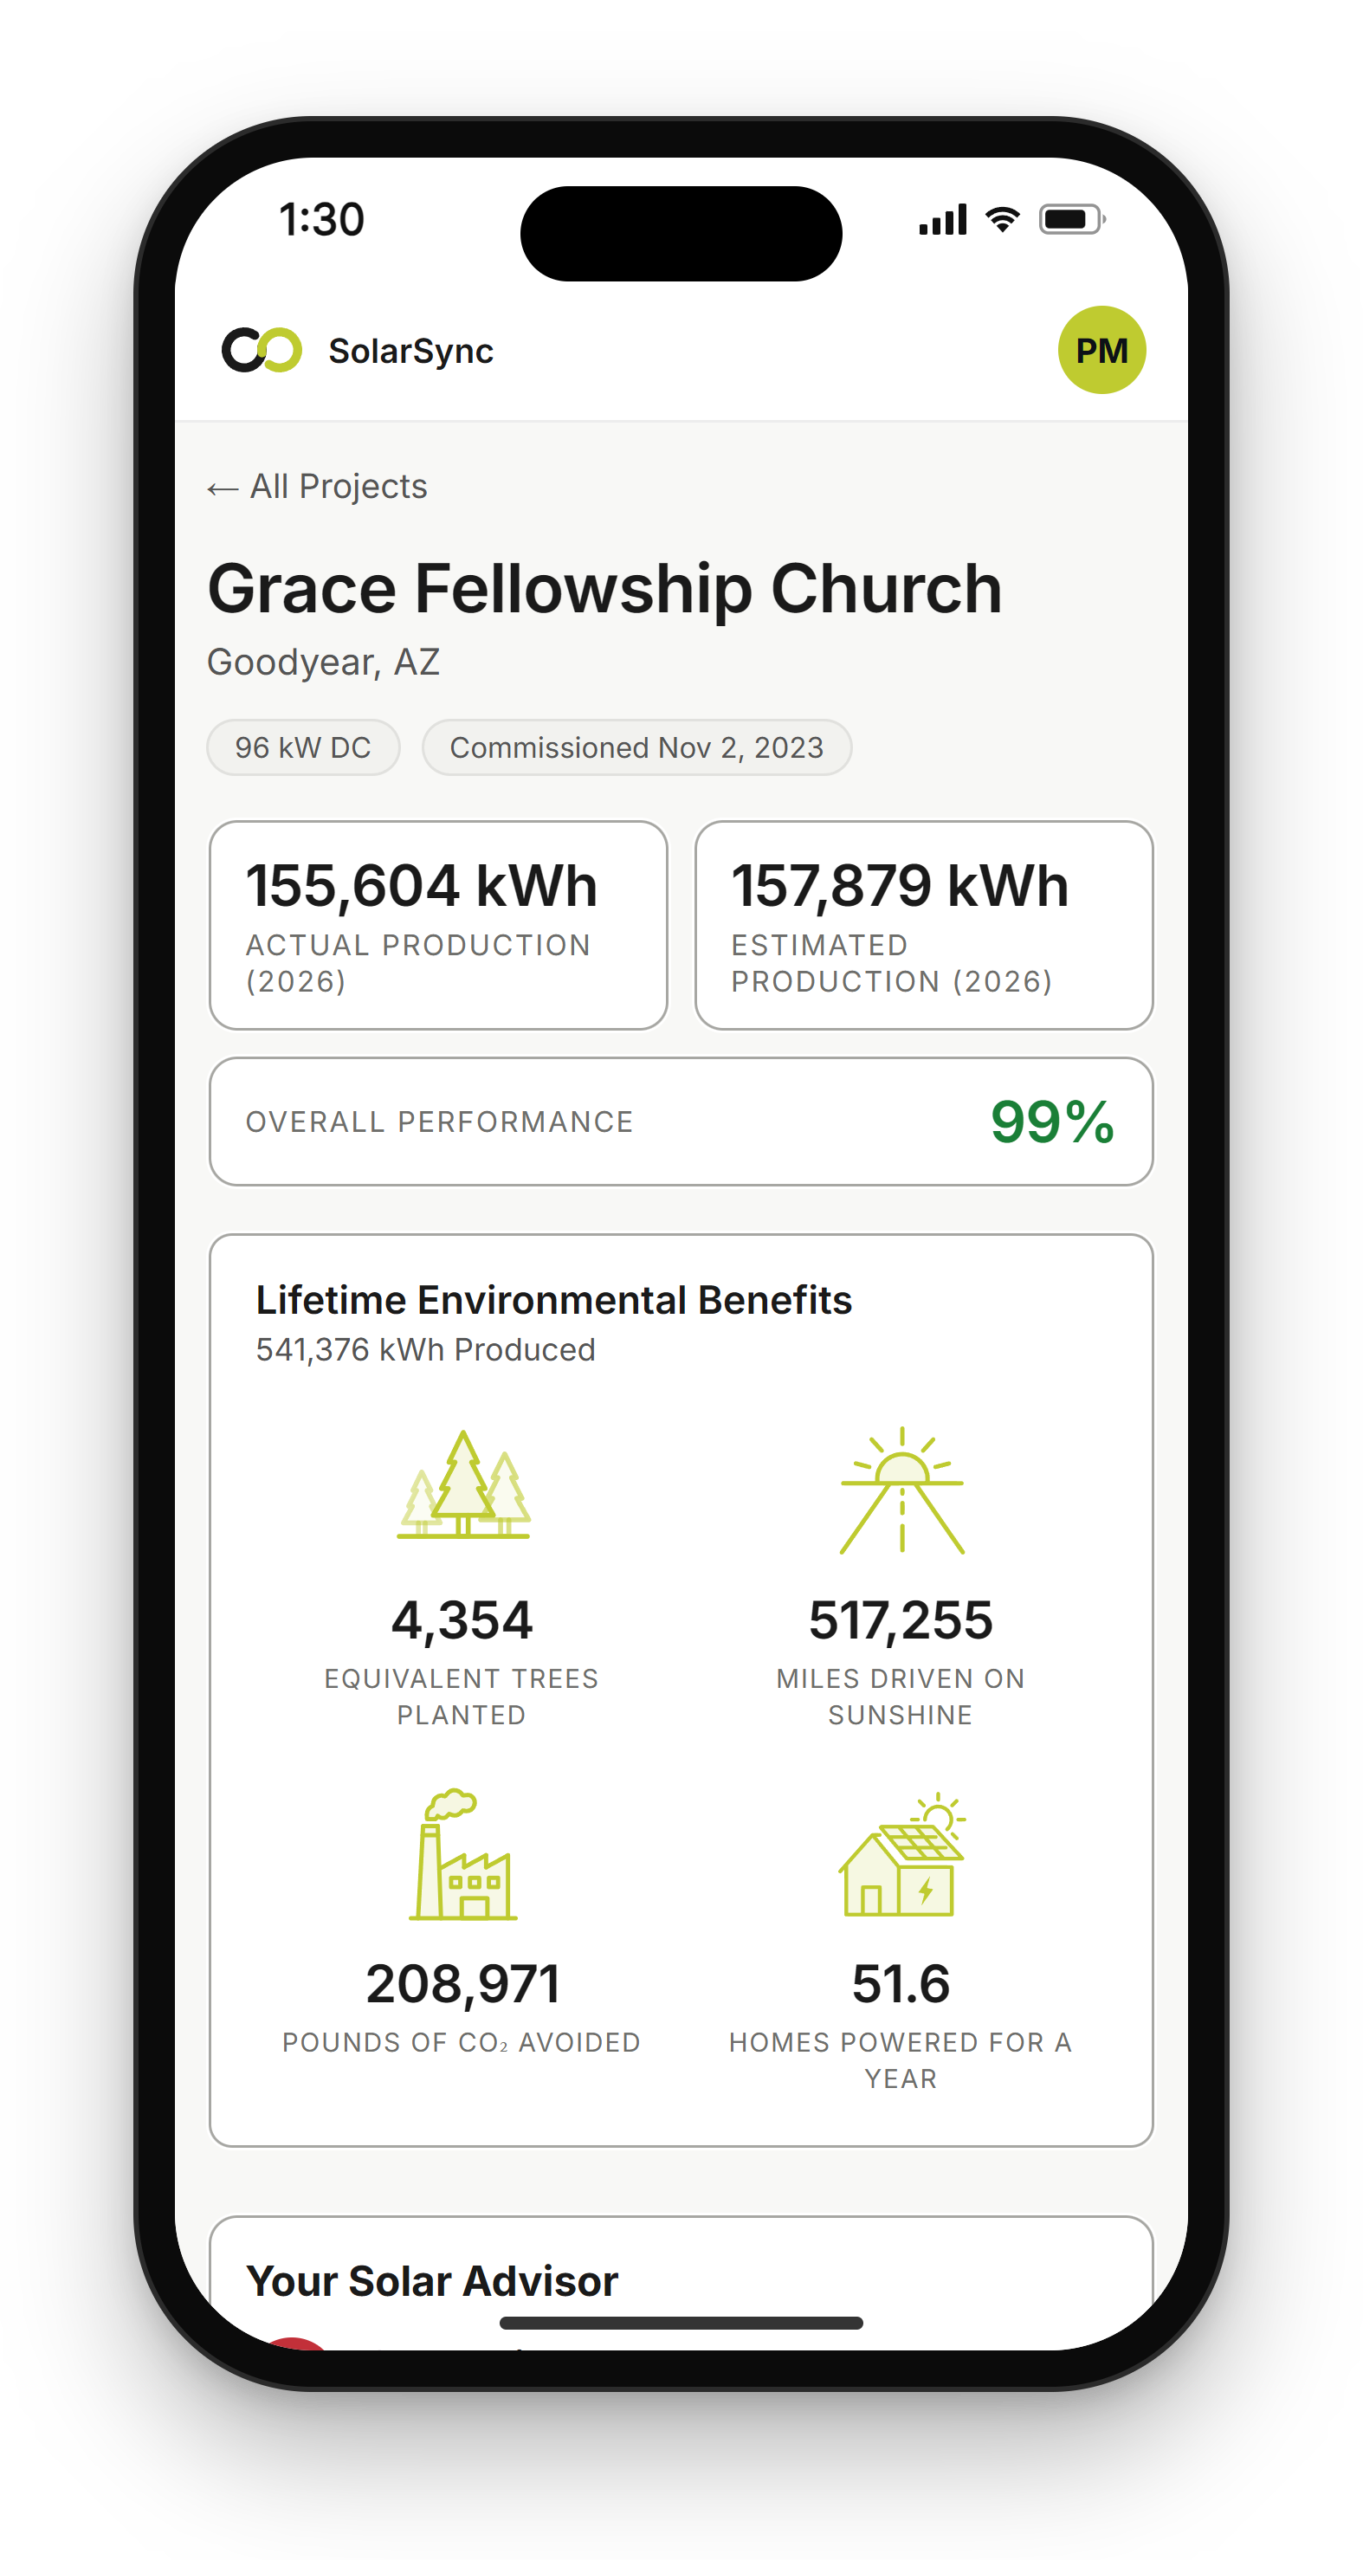
The Customer Portal has no sidebar and no navigation tree. It is a simple page, with the owner’s system name at the top and their Solar Advisor’s name and direct number right underneath. Includes the production estimate, a seven-day forecast, the monthly breakdown, updates from your team, and their Post-Solar Analysis once it is available.

They can download their own CSV or hit Print Report and get a clean light-theme document that prints straight to PDF for a board packet, a landlord or a lender. They can file a request from the same page, and it lands in your queue with your internal notes kept separate from what they see.

  • You create the account. There is no public sign-up and no self-serve door into your workspace, which also means there is no orphaned login you forgot you issued.
  • Roles are Admin, Employee and Customer, on a multi-tenant workspace with an audit log you can export, credentials encrypted with AES-256-GCM, and Postgres row-level security as a backstop.
  • Available on iOS and Android with real push notifications, and responsive at every size in between. Up to three accounts can stay signed in on one device.
  • They choose how they hear from you — email, text or push, across six cadences, with quiet hours. Not another inbox they have to remember to check.

the same page, right on your phone

SolarSync is one responsive app, not a set of platform builds — the portal reflows to the phone, the console reflows to the phone, and the sidebar becomes a drawer behind a hamburger.

Available on iOS and Android with real push notifications, so an alert reaches a person anywhere.

  • Push, email and SMS, six cadences, quiet hours, per-project mutes, and up to ten push devices per user.
  • Dark and light themes and three density scales, because a portfolio manager and a school business officer do not want the same screen.
  • Print Report works from the phone too, which is how most board packets actually get made.

” “

I went back and looked at the original production forecast that was stated 9 years ago, and the production is within 18 kWh’s of estimated production since placed in service! That is remarkable.

First technology capital

on the town of payson, az municipal solar system

Watthub Founded in 2010
612+ Completed Projects
450+ MW Deployed by Watthub and partners
225+ Unique Company Partners

tell us what you’re managing

SolarSync is in limited release and we onboard companies one at a time, which means a real person at Watthub will contact you. Tell us roughly how many projects you carry and which brands are in use, and we will tell you honestly whether the product is ready for you yet.

  • Running SolArk or Yotta? No problem. Neither of them publish a public API, and we will explain the eGauge overlay approach before you commit to anything.
  • Own a system rather than install them? Contact us and we’ll help figure out how to get the right monitoring set up for you.
  • Get set up in a day, not a month.

Name(Required)
Email(Required)
We use this to reply to you and nothing else.